
By Rob Mitchum // November 12, 2012
Sometimes making sense of big data starts with finding the right metaphor. As cheaper genetic sequencing produces a growing waterfall of data, scientists need to organize all that new information into a form that makes the intricate world of genes and biology easier to understand, explain and investigate further. But unlike other big data fields, genetics does not have a visual “playing field” that is easy to visualize, like the night sky for astronomy or the globe for climate. Many attempts to visualize how genes interact with each other end up taking the form of the “hairball,” a dense web of points and lines that does little more than emphasize the intimidating complexity of genetic networks.
In his talk at the Computation Institute on November 9th, Mark Gersteinof Yale presented several metaphorical options for understanding the cell’s genetic network. At various points, he offered comparisons between gene interactions and a road network, a corporate organization chart or a computer operating system, each with their own strengths and weaknesses for making sense of the data. Gerstein grappled with these options as part of the ENCODE project, a large consortium formed to understand the functional elements of the human genome that recently published their first wave of articles. In order to transform understanding of the genome from a string of DNA bases to a living, interacting network of genes, regulatory elements and enzymes, ENCODE needed a new metaphor for depicting the system.
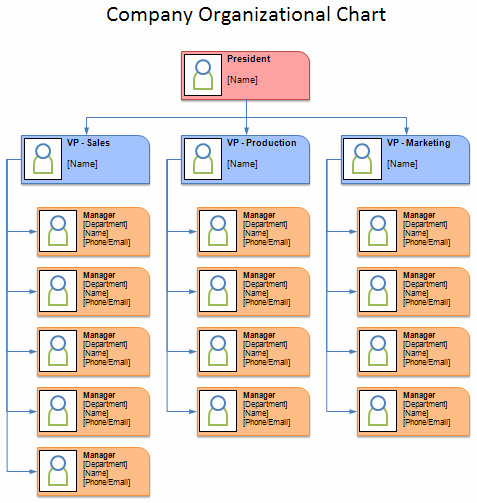
Two options appealed to the researchers. The highway system, marked as it is by well-connected hubs and bottlenecks of restricted flow, can represent the unequal distribution of connections between genes. Alternatively, a company org chart can depict the hierarchy of genetic interactions, with some regulatory elements more likely to control other factors, while some elements are more likely to be controlled by factors higher up the chain. Gerstein and ENCODE researchers took over 100 transcription factors and organized them according to the latter metaphor, finding that they fit into a three-tiered structure of “master regulators,” “middle managers,” and “workhorses.” They could then look more closely at the specific factors in each tier, finding that those elements at the top of their genetic org chart were more influential upon biological processes and more evolutionarily “conservative,” similar across different species because of their critical role for life.
A third metaphor explained by Gerstein offered insight even through how it didn’t perfectly represent the function of the genome. One way to think of a genome, he said, is as “the fundamental operating system of life,” the core instructions that run the programs of a living cell. So Gerstein compared the hierarchical network of the genome to the open-source operating system Linux, which “evolves” over time as users modify and improve its code. However, the comparison revealed that the patterns of change are very different within the two systems, both in structure (as pictured above) and the dynamics of change. While genes with large influence and many connections are resistant to evolutionary change over time, the pieces of code that are most influential in Linux are more likely to change as developers look to make improvements with the largest impact.
“In the biological situation you have random change, and you don’t want to have random changes where you have a lot of connections,” Gerstein said. “In Linux or a computing operating system, you have intelligent designers who are making changes that they believe are not going to be disruptive. Consequently, they’re going to make those changes in a very different pattern.”